

From problem to verified solution
Stop fixing symptoms
APS guides teams through clear process steps — from problem definition and containment to root-cause analysis countermeasures, verification and standardization.
- DefineForm the team and set the scope.
- ContainTake immediate action.
- AnalyzeFind and verify root causes.
- SolveImplement and track countermeasures.
- VerifyConfirm effectiveness and measure results.
- StandardizePrevent recurrence and share learning.
What APS helps you manage
One structured process - clear problem-solving discipline
Structured Problem Solving
Run A3, 8D, Six Sigma, DMAIC or your own company-specific process.
Root Cause Analysis
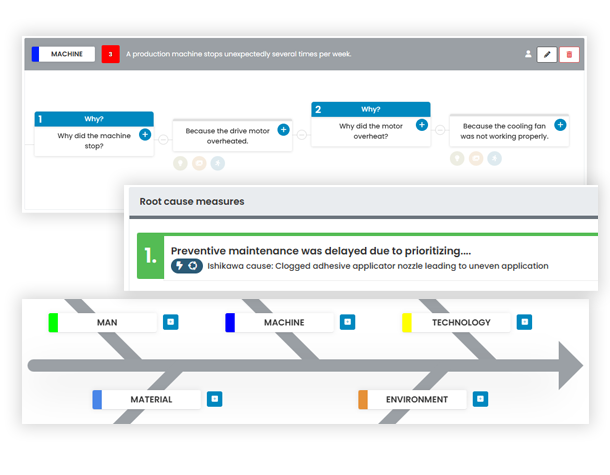
Use Ishikawa, 5 Why and other tools to move from symptoms to verified causes.
Modular Workflows & Ownership
Configure forms, responsibilities, deadlines and countermeasures to match your process.
Verification & Prevention
Confirm effectiveness, define preventive measures and standardize learning.
Part of the Performance Storyboard system
Problems connected to performance and improvement
APS is connected with the wider Performance Storyboard system. Problems can start from deviations and audits, or from performance gaps, and continue into actions, KPI tracking and standards.
- PMBDeviations & audits
- DAMData & audits
 APSAdvanced Problem Solving
- TasksActions & follow-up
- KPI TrackingPerformance
- StandardsDocuments & learning
A3 / 8D Problem Solving ROI Calculator
See how APS works
We'll show you how APS can help you!


