

From checklist to improvement
A finding only matters
if something happens next
DAM connects audit results with ownership and follow-up, so deviations do not disappear in reports or spreadsheets.
- AuditConduct audits using structured checklists.
- FindIdentify deviations and opportunities.
- AssignAssign responsibility and set deadlines.
- VerifyTrack actions and verify implementation.
- ImproveUse insights to drive improvement.
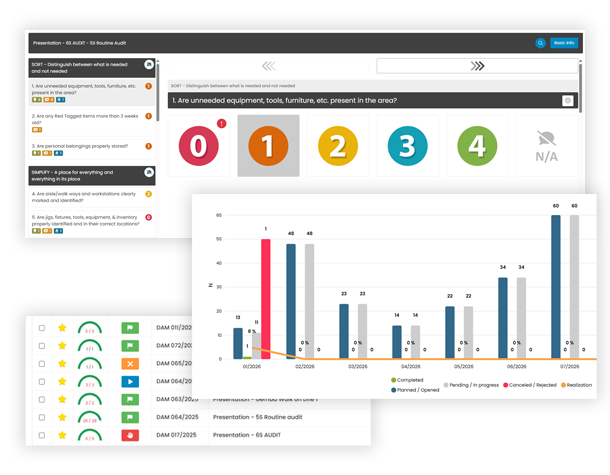
What DAM helps you manage
One system - a disciplined audit routine
Standardized Audits
Use structured questionnaires, scoring and repeatable audit criteria.
Gemba Evidence
Capture findings, comments and photos directly where the work happens.
Actions & Ownership
Assign responsibilities, deadlines and PDCA follow-up to identified gaps.
Results & Trends
Review scores, history and recurring deviations, and connect audit results with performance indicators.
Built for different audit routines
Flexible across Lean, quality and compliance
- 5S
- Gemba Walks
- Layered Process Audits
- Safety
- Quality
- TPM
- ISO / Compliance
- Risk Assessment
Part of the Performance Storyboard system
Findings connected to improvement
DAM works with the wider Performance Storyboard system, so audit findings can continue into action management, problem solving, standards and performance management.


 DAMDigital Audit Management


Audit ROI Calculator
Heinrich Pyramid Calculator
See how DAM works
We'll show you how DAM can help you!


