

Ishikawa Diagram
A Structured Approach to Exploring the Causes of a Problem
The Ishikawa diagram helps teams organise possible causes, examine a problem from different perspectives and build a shared basis for investigation. Used as part of root cause analysis, it supports better decisions about what to investigate and which process conditions may need to change.
What Is an Ishikawa Diagram?
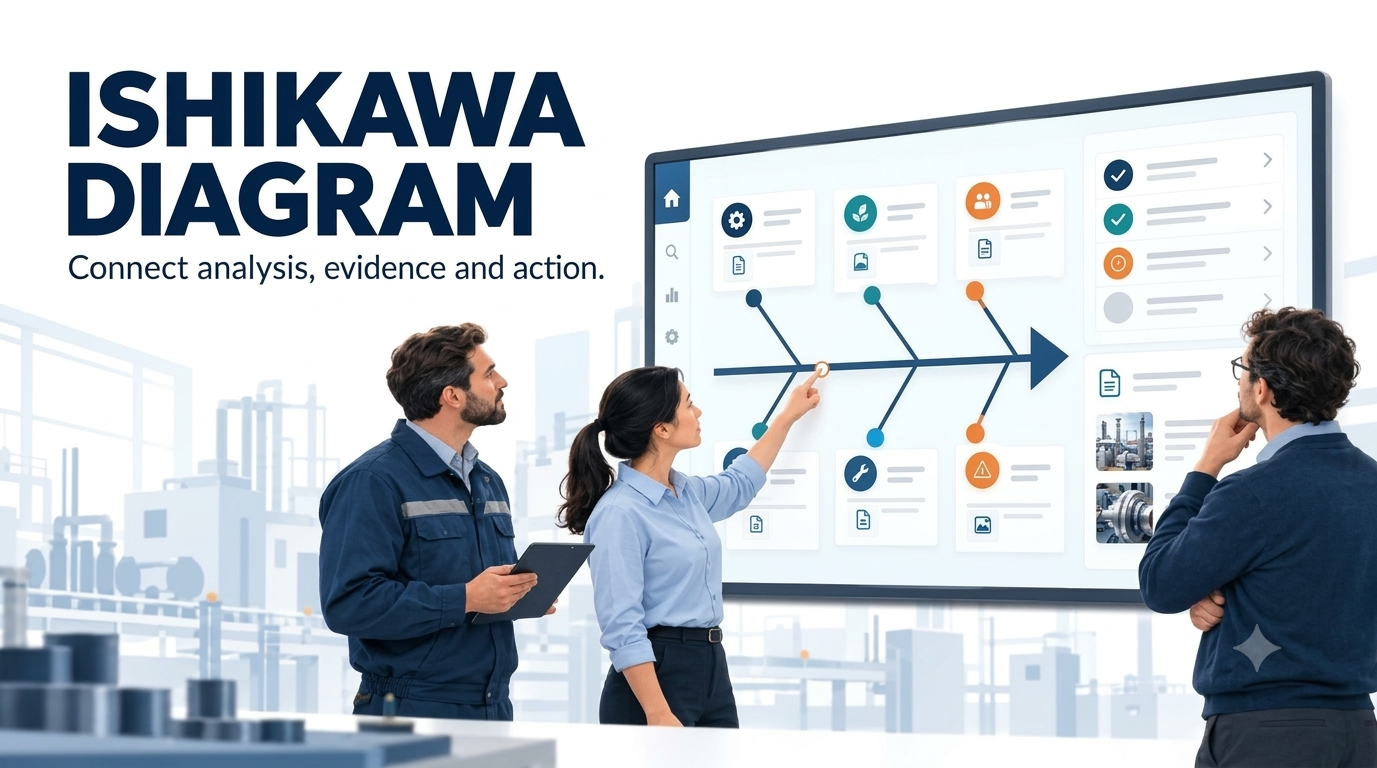
An Ishikawa diagram, also known as a fishbone diagram or cause-and-effect diagram, is a visual quality tool named after Kaoru Ishikawa.
The problem appears at the head of the diagram. Main branches represent categories of possible causes, while smaller branches capture specific explanations within each category.
Its purpose is to make the team’s thinking visible and structured. The diagram identifies potential causes; evidence is needed to establish which ones explain the problem.

Purpose of the Ishikawa Method
When a problem occurs, teams often focus on the first plausible explanation. The Ishikawa method encourages a broader investigation before decisions are made.
It helps teams:
⦁ Explore different explanations instead of relying on initial assumptions.
⦁ Combine practical knowledge from people across departments.
⦁ Examine process conditions rather than stopping at individual mistakes.
⦁ Identify gaps in knowledge and define what needs to be checked.
⦁ Organise the investigation before selecting corrective actions.
The method can support investigations into quality defects, equipment failures, delivery delays, process variation and recurring operational problems.

The 6M Categories
In manufacturing, possible causes are commonly grouped into six categories, known as the 6Ms.
Category What to examine
People — Manpower Skills, task understanding, workload and communication.
Machine Equipment, tools, fixtures, settings and maintenance conditions.
Method Work sequence, procedures, standards and process controls.
Material Specifications, variation, condition and handling of materials or components.
Measurement Inspection methods, measuring equipment and reliability of data.
Environment — Mother Nature Lighting, temperature, humidity, cleanliness and other working conditions.
These categories provide a starting point. Adapt them to the process being investigated: a service or administrative process may benefit from different headings.
How to Apply the Ishikawa Method
1. Define the Problem Clearly
Describe the observed deviation: what happens, where it happens, when it happens and how often. Include the expected condition and available data.
Avoid including an assumed cause in the problem statement. “Components are assembled incorrectly” describes an observation; “operators are insufficiently trained” already assumes an explanation.
2. Involve the Right People
Bring together people who perform the work and those with relevant technical or process knowledge. Cross-functional participation helps uncover conditions that a single department may overlook.Observe the actual process wherever possible, so the discussion reflects how work is performed.
3. Identify and Organise Possible Causes
Place the problem at the head of the diagram and add suitable cause categories. Record specific, testable explanations on the branches.
For example, replace “poor instructions” with “the work instruction does not show the required component orientation.” Precise wording makes the next investigation step clearer.
4. Investigate the Most Plausible Explanations
Use observations, defect patterns and technical knowledge to decide what to investigate first.
For each selected explanation, define:
⦁ What needs to be checked.
⦁ What evidence would support or contradict it.
⦁ Who will investigate it and by when.
Keep assumptions, observations and verified findings distinguishable. The number of entries on a branch does not establish its importance.
5. Select Actions and Verify Results
Once the causes are supported by evidence, define corrective actions that address them. Assign responsibilities, deadlines and acceptance criteria.
Verify both that the changes were implemented and that they are effective under representative operating conditions. Update relevant standards and review whether similar processes need the same improvement.
Ishikawa and 5 Whys: Complementary Tools
The Ishikawa diagram helps teams explore a range of possible causes. 5 Whys analysis helps examine a selected causal chain in greater depth.
Used together, they support a structured investigation:
⦁ Ishikawa: What factors could contribute to this problem?
⦁ 5 Whys: Why does a particular condition exist?
Both require evidence. Neither a completed diagram nor a sequence of answers automatically proves a root cause.
These tools can be used within broader problem-solving approaches such as A3, 8D, QC Story and PDCA.
Common Mistakes to Avoid
The method becomes less useful when teams:
⦁ Start with a problem that is too broad.
⦁ Record vague labels such as “human error.”
⦁ Select causes by agreement without checking evidence.
⦁ Choose solutions before understanding the failure mechanism.
⦁ Treat a completed diagram as the end of the investigation.
A useful Ishikawa analysis leads to clear investigation tasks and evidence-based decisions.
Digital Ishikawa Analysis with Performance Storyboard®
APS – Advanced Problem Solving, part of Performance Storyboard®, supports Ishikawa diagrams and 5 Whys analysis within structured problem-solving workflows.
Teams can connect their analysis with tasks, responsibilities, timelines and progress reviews, making it easier to coordinate work across departments and maintain visibility throughout the investigation.
APS also supports approaches such as A3, 8D and QC Story, helping organisations establish a consistent process for analysing problems, implementing actions and reviewing results.
Explore how APS can support structured root cause analysis in your organisation.
Discover APS – Advanced Problem Solving →