The productivity and efficiency gap between world-class manufacturers and industry averages continues to widen. Studies show that top pharmaceutical manufacturers experience only a fraction of the quality deviations seen in typical operations, while achieving nearly double the Overall Equipment Effectiveness (OEE). At the heart of this performance gap lies one critical capability: the ability to identify and eliminate root causes quickly and systematically. Manufacturing problems rarely have a single cause. Instead, they are the result of interrelated factors across people, machines, materials, processes, and data. The Ishikawa (Fishbone Diagram) Japan provides a structured framework to untangle this complexity. When combined with real-time visibility and analytics platforms like performance-storyboard, it becomes a powerful engine for continuous improvement in modern factories.
Why Root Cause Analysis Determines Manufacturing Performance
Effective root cause analysis (RCA) is the difference between reactive firefighting and proactive performance management. While many factories focus on fixing immediate symptoms—such as defects, downtime, or labor overruns—world-class manufacturers invest time in understanding why these issues occur repeatedly.
Root cause analysis success depends on three foundational elements: data availability, organizational discipline, and structured problem-solving methods. Without these, even experienced teams rely on assumptions rather than evidence. Visualization tools such as the Ishikawa Fishbone Diagram provide a common language for teams to align on problems, explore causes, and test solutions using facts instead of opinions.
What Is the Ishikawa Fishbone Diagram?
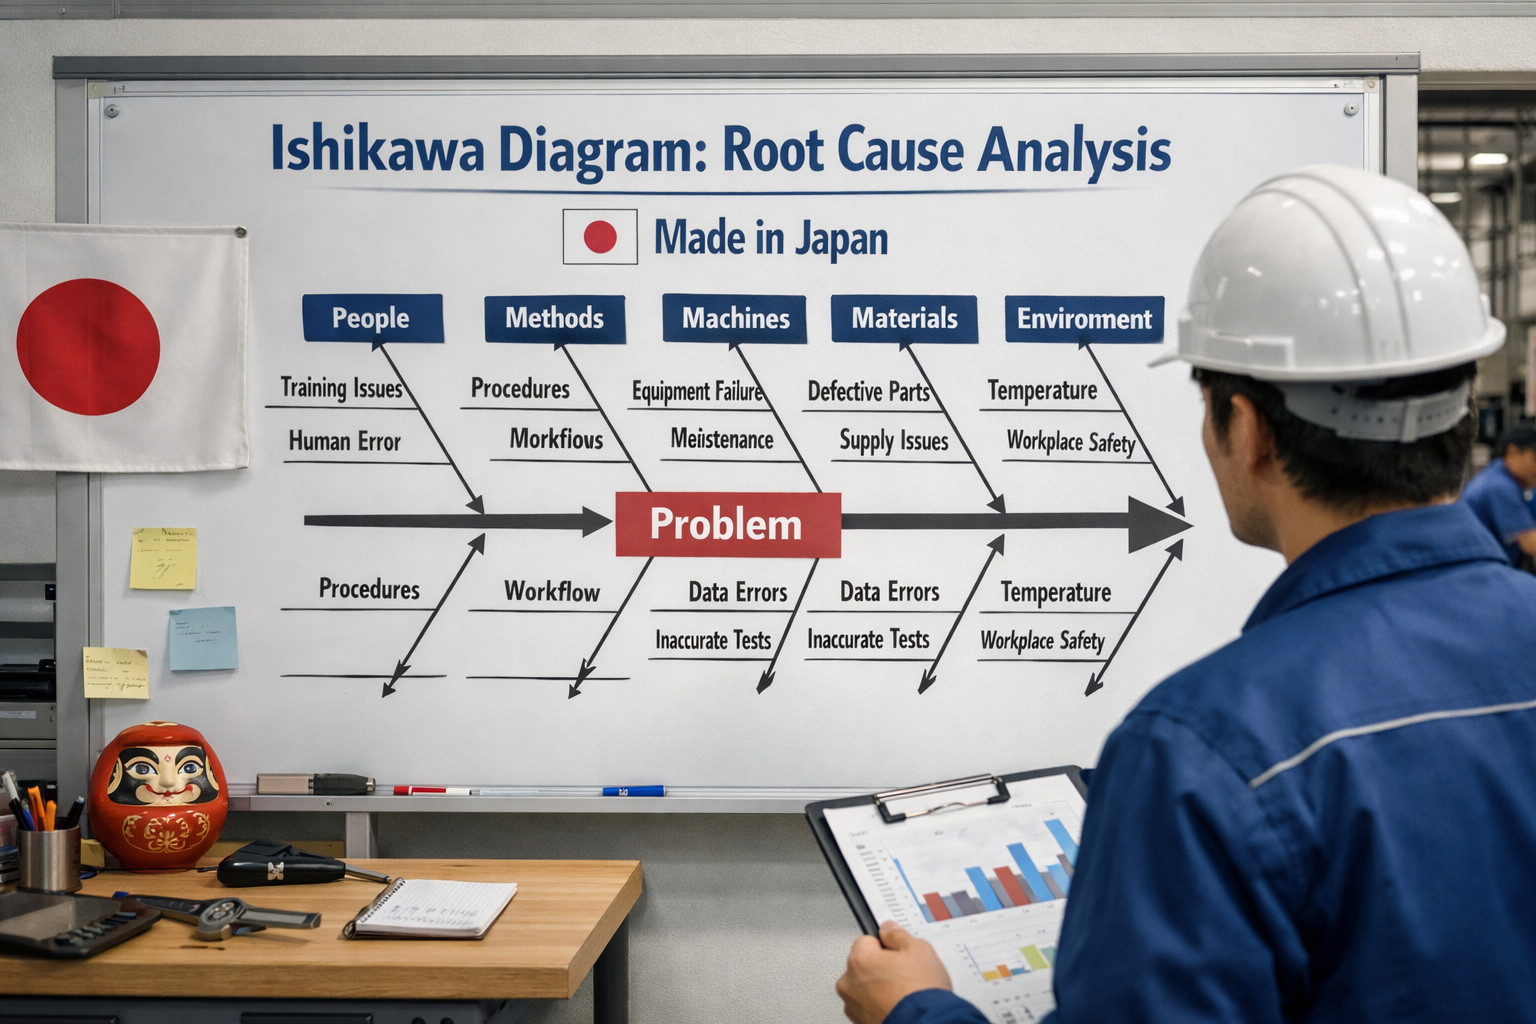
The Ishikawa (Fishbone Diagram) Japan, also known as the cause-and-effect diagram, is a visual tool used to systematically identify potential root causes of a specific problem. It supports structured brainstorming by categorizing causes into logical groups, allowing teams to see relationships that may otherwise remain hidden.
Developed in the 1960s by Dr. Kaoru Ishikawa, the diagram aligns closely with scientific management principles. Teams begin by forming hypotheses about possible causes and then validate or reject them using data. In digitally enabled factories powered by platforms like performance-storyboard, this validation process becomes faster, more accurate, and easier to sustain.
The 6M Framework for Manufacturing Root Causes
In manufacturing, the Ishikawa Fishbone Diagram is most commonly organized using the 6M framework. This ensures comprehensive coverage of all potential cause areas and reduces the risk of overlooking systemic issues.
Manpower
Human-related factors include skills, training levels, fatigue, communication gaps, and adherence to standard operating procedures. Many “operator errors” are actually symptoms of deeper system failures such as inadequate training or unclear instructions.
Machines
Machine-related causes cover equipment reliability, maintenance practices, calibration issues, and performance variability. Without predictive maintenance and condition monitoring, minor machine issues can escalate into chronic downtime.
Material
Material causes include variability in raw material quality, improper storage, contamination, and supplier inconsistencies. Even the most optimized process cannot compensate for unstable input materials.
Method
This category focuses on how work is performed, including process design, standardization, setup procedures, and changeovers. Paper-based SOPs often introduce variability that digital work instructions can eliminate.
Measurement
Measurement-related causes involve inaccurate data, poorly calibrated instruments, inconsistent inspection practices, or delayed reporting. Reliable RCA depends on trustworthy, real-time metrics.
Mother Nature (Environment)
Environmental factors such as temperature, humidity, lighting, and layout can significantly impact quality and productivity, especially in regulated industries like pharmaceuticals.
Top Benefits of Using the Ishikawa Fishbone Diagra
Manufacturing problems often involve dozens of interacting variables. The fishbone diagram transforms abstract discussions into a structured visual map, making it easier to identify patterns, dependencies, and gaps in understanding.
- Makes cause-and-effect relationships visible
- Helps teams focus on facts instead of assumptions
- Simplifies communication across departments
End-to-End Problem Analysis
By forcing teams to examine every major cause category, the fishbone diagram ensures a holistic approach to root cause analysis. This prevents organizations from treating symptoms while deeper systemic issues persist.
- Encourages comprehensive investigation
- Reduces recurrence of the same problems
- Supports long-term process stability
Cross-Functional Collaboration
Effective RCA requires input from production, quality, maintenance, planning, and engineering. The fishbone diagram provides a neutral framework that encourages collaboration and shared ownership.
- Aligns teams around a single problem definition
- Reduces siloed decision-making
- Improves speed and quality of resolution
Foundation for Continuous Improvement
Beyond one-time problem-solving, the Ishikawa diagram supports ongoing improvement initiatives such as Lean, Six Sigma, and Kaizen. When digitized using platforms like performance-storyboard, fishbone analyses become living documents that evolve with the factory.
- Enables repeatable RCA processes
- Strengthens continuous improvement culture
- Connects insights directly to KPIs
How to Create an Ishikawa Fishbone Diagram in 5 Steps
Step 1: Identify a Clear, Measurable Problem
A strong fishbone analysis starts with a precise problem statement. Vague descriptions lead to vague solutions. The problem should be specific, measurable, and tied to a business outcome.
- Example: “3.6 overtime hours per operator per month causing a 15% increase in labor costs”
- Aligns analysis with S.M.A.R.T. objectives
- Enables data-based validation
Step 2: Define Major Cause Categories
Once the problem is clear, teams identify the major cause categories relevant to the issue. While the 6M framework is standard, categories can be adapted for specific challenges such as scheduling or workforce management.
- Encourages structured brainstorming
- Ensures no major area is overlooked
- Supports cross-functional input
Step 3: Identify Probable Factors
Each category is then broken down into detailed sub-causes. This is where teams explore operational realities such as maintenance practices, training gaps, or process variability.
- Converts assumptions into testable hypotheses
- Highlights actionable improvement areas
- Prepares the ground for prioritization
Root Cause Analysis in the Age of Industry 4.0 and AI
Traditional fishbone diagrams rely heavily on manual brainstorming and delayed data. Industry 4.0 transforms RCA by embedding real-time visibility, automation, and AI into the process. This turns fishbone diagrams into dynamic, continuously validated tools.
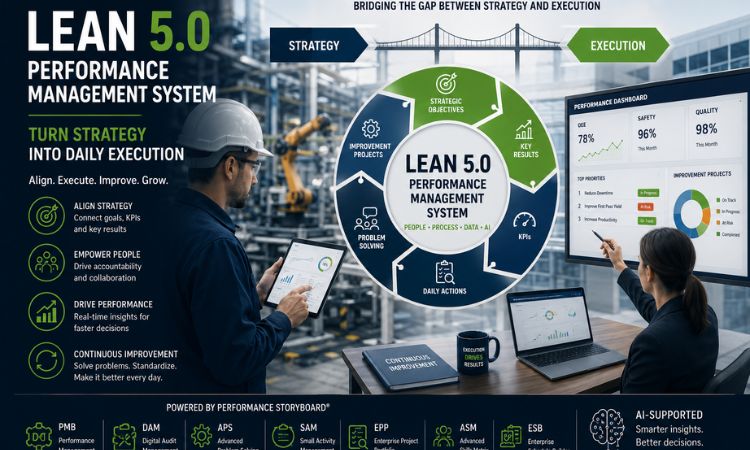
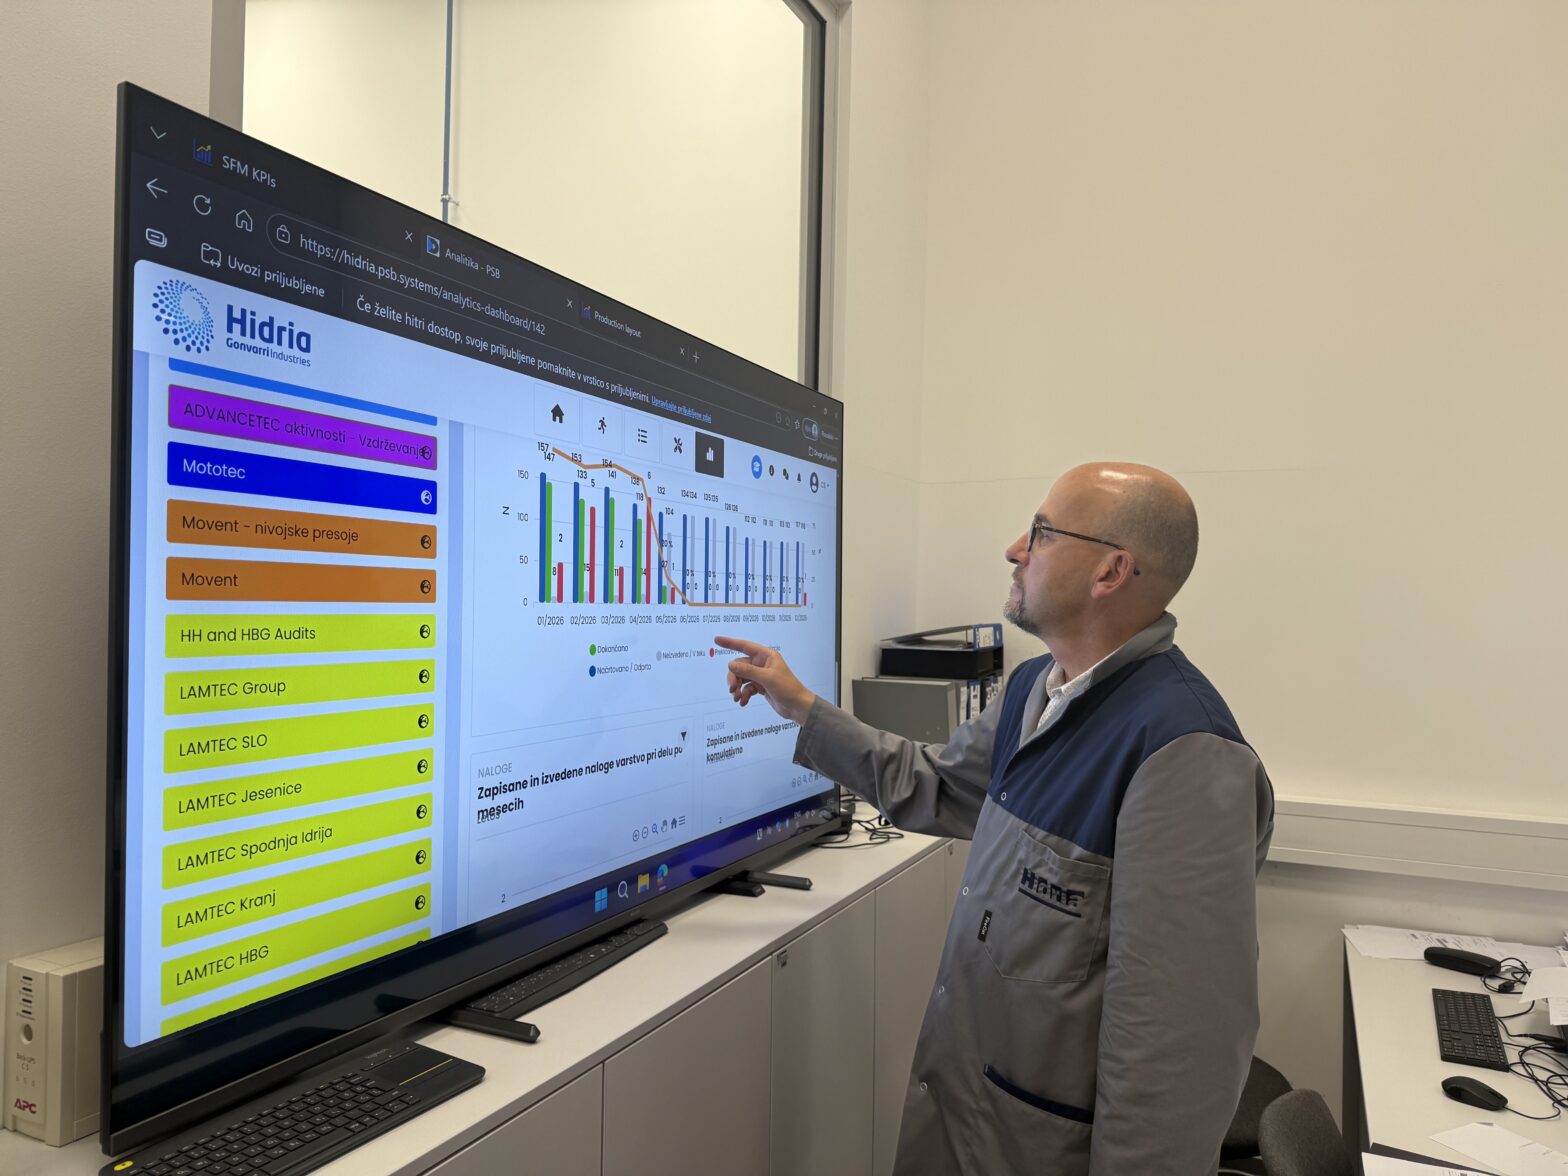
With platforms like performance-storyboard, manufacturers can link fishbone causes directly to live KPIs, alerts, and historical trends—closing the loop between analysis and action.
How performance-storyboard Enhances Fishbone-Based RCA
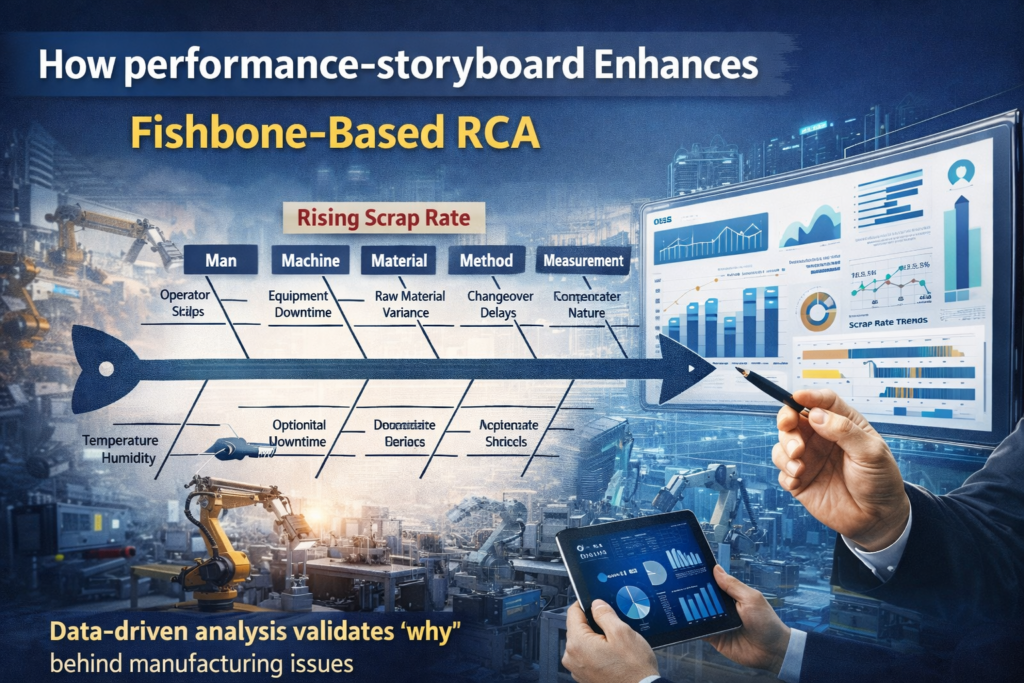
Performance storyboard enables manufacturers to move from static root cause analysis to continuous performance optimization.
Conclusion
The Ishikawa Fishbone Diagram remains one of the most powerful root cause analysis tools in manufacturing. However, its true value is unlocked when combined with real-time data, analytics, and AI-driven insights.
Manufacturers that embed fishbone analysis into digital platforms like performance storyboard, gain a decisive advantage: faster problem resolution, fewer recurring issues, and a culture of continuous improvement that drives long-term operational excellence.